Uber is an every day utility that people become very comfortable using. The simplicity and ease of it's use become so seamless in peoples lives that the service can become taken for granted.
When the superior features and reasons to use Uber become taken for granted, the 'reason to use' Uber also gets commoditized; which in turn reduces brand loyalty and frequency of use.
Our objective was simple. Remind people of the role of Uber in their lives and demonstrate how the superior service and value is not a commoditized-utility, but a partnership that helps to improve their day to day lives.
Our strategy was to demonstrate the superior service and value to 'Riders' day to day lives.
We wanted to start small for 2016, so we targeted a select few key cities for a pilot to see if we could get people to talk about Uber as more than just price or a utility.
We targeted five cities: Singapore, Kuala Lumpur, Jakarta, Manila and Bangkok. All have good market penetration, high mobile usage (around 85% of working adults) and importantly, high usage of Uber as a commodity.
To really engage in a conversation with our Riders, we know that we have to make the conversation about them. Through a simple yet personal story about how they moved through 2016, we wanted to surprise, delight and reconnect with them.
The most personal way to achieve that was through a lighthearted and fun look at their habits and trips with Uber during 2016.
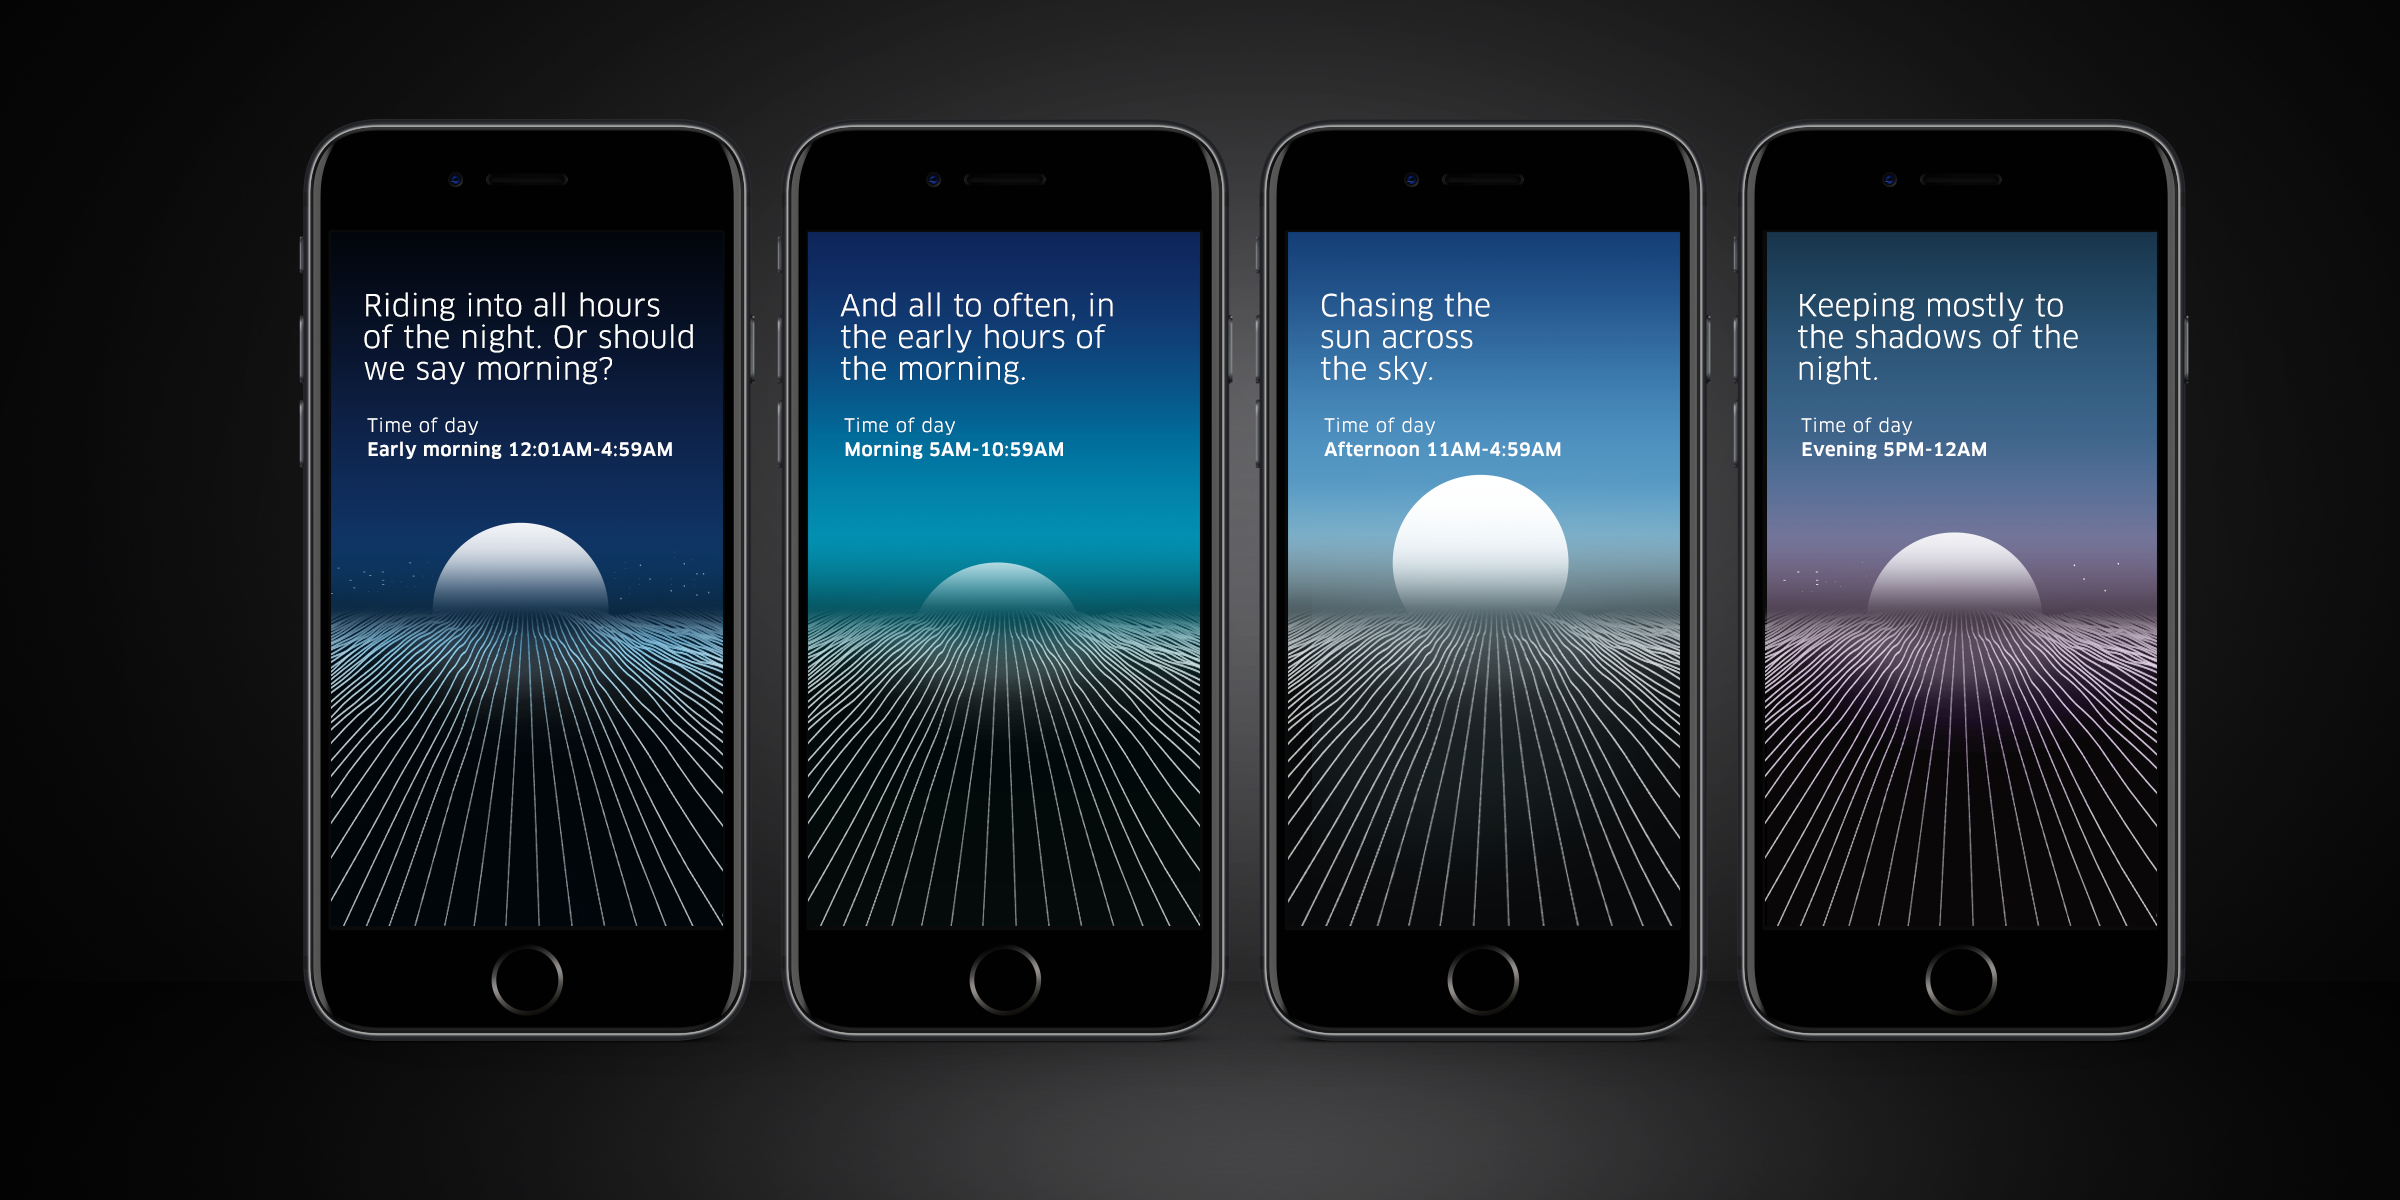
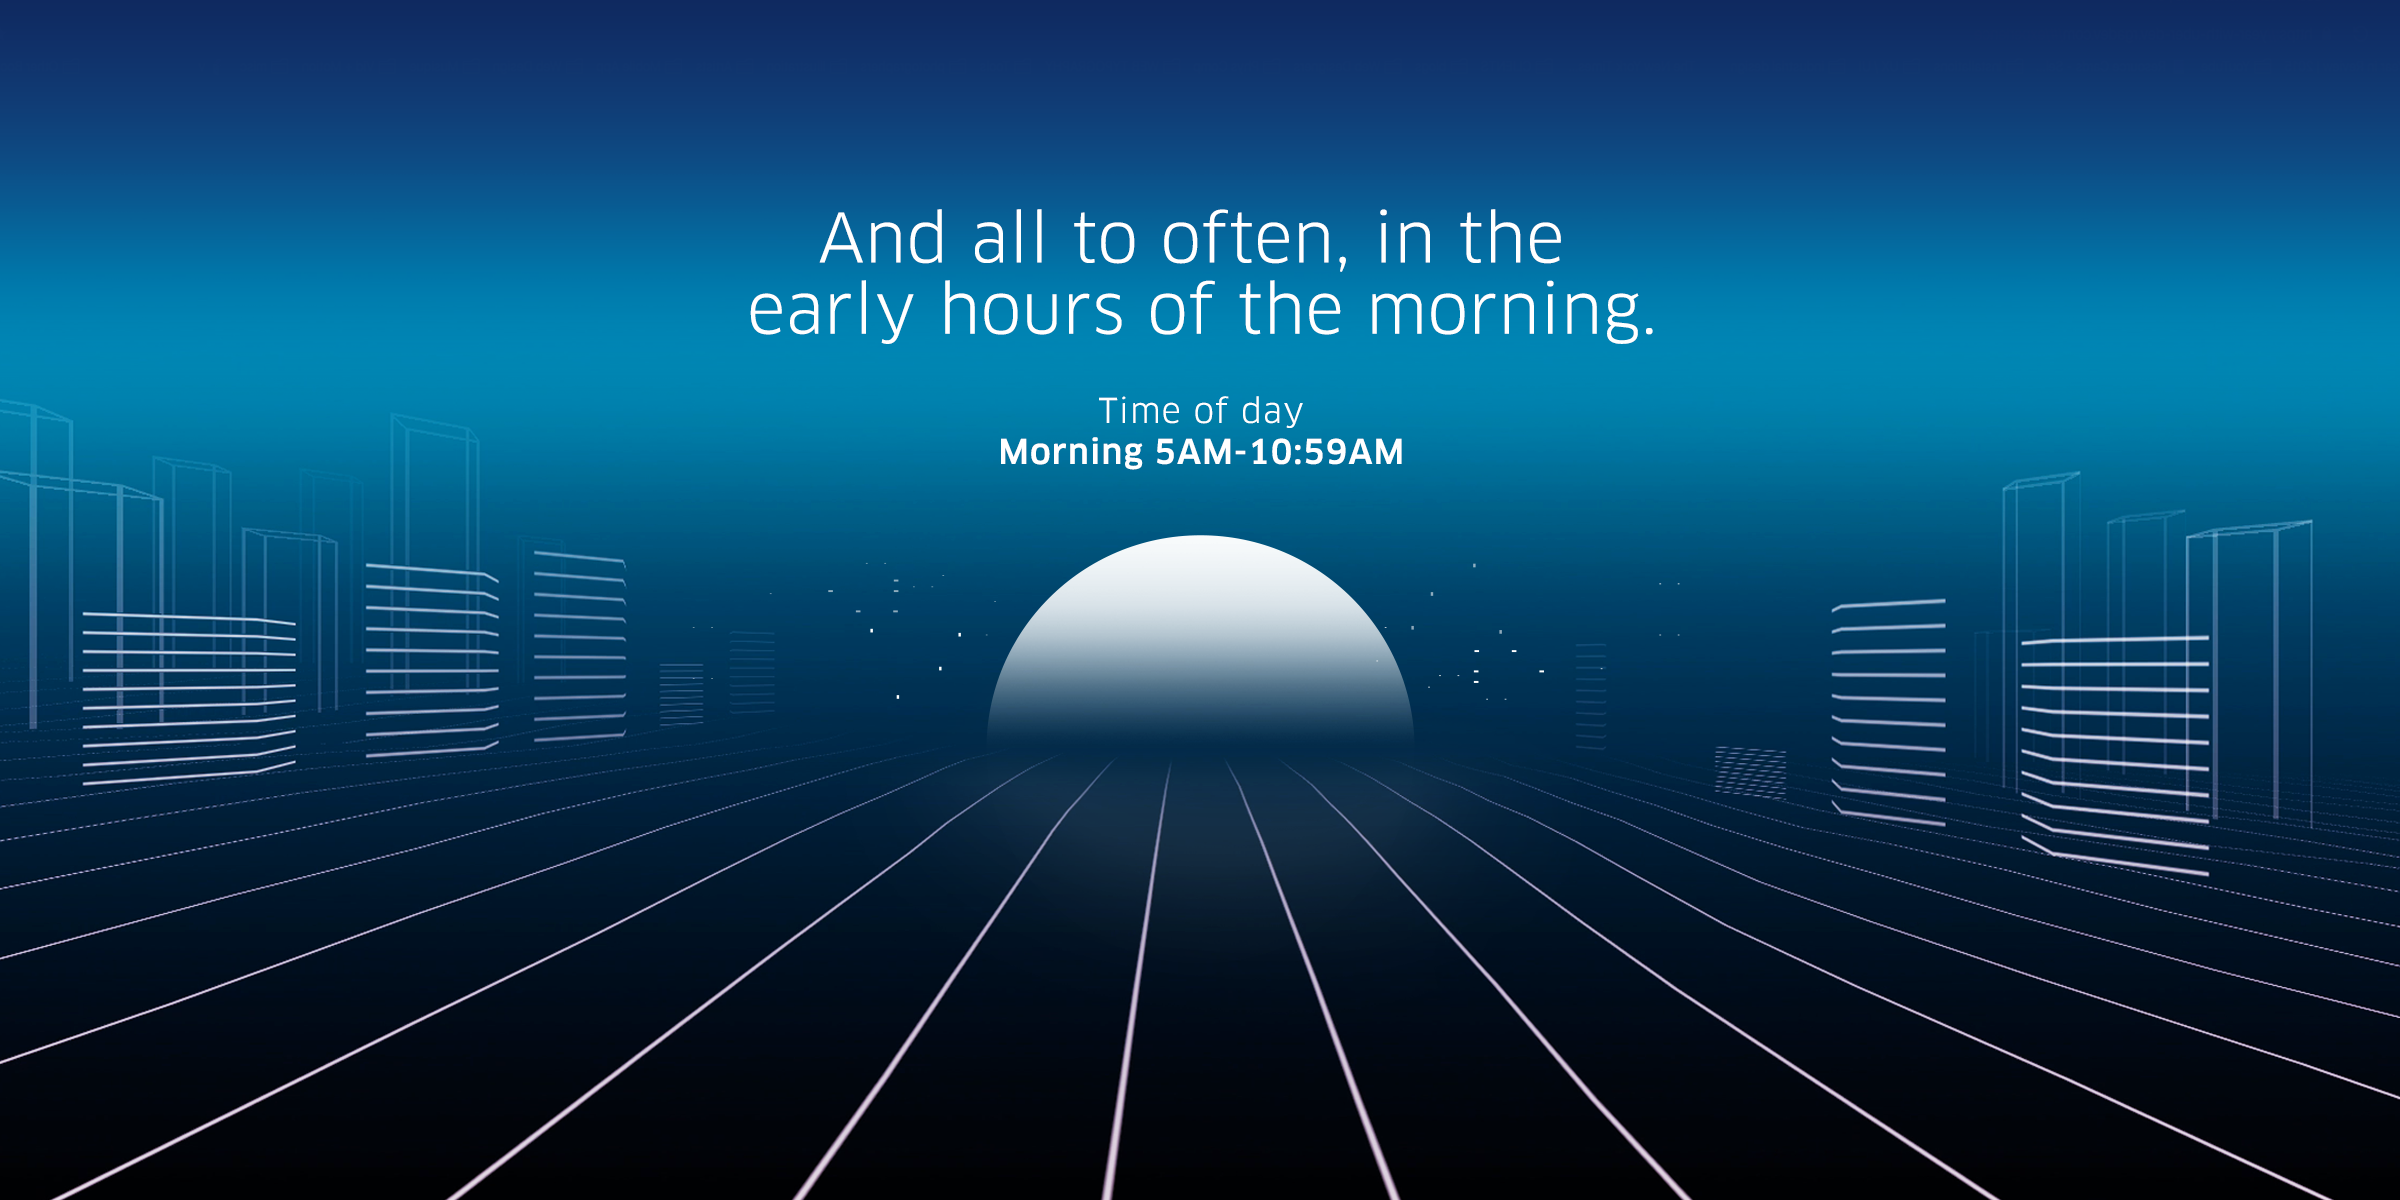
We achieved this creatively through the visualization of 1,020 contextual data points ranging from journey locations, times and lengths of trips, right through to city specific references such as sunrise, sunset and weather conditions. We even overlaid this data with contextual and relevant local cultural nuances for events like Ramadan, Chinese New Year and Formula One Grand Prix.
We completed their look at 2016 with a personalized calling card and 'Rider type' for them to share on social media.
What started as a pilot in five cities became talked about in 195 countries.
- 4,096,839 Earned Social Impressions.*
- 974,849 sites visits in first 7 days of launch.
- 'Year With Uber' top trended on Twitter for 19 hours without spend.
- Over 16,000 Year With Uber Rider visualisations shared on Twitter.
- National TV and press coverage in markets.
- 115,296 Year With Uber Rider journeys mapped in first 4 weeks.
- 55% of users say they are now more likely to use Uber.
* Based on tweets with campaign hashtag and follower count, average Facebook friend count and Facebook shares.